
Sequence of Returns and a Look at History
There is a lot of debate about the 4% withdrawal rate in retirement. Some believe that the markets will continue to perform adequately for retirees, allowing them a withdrawal rate of 4% a year adjusted for inflation while safely ensuring they never run out of money. But some leading economists and financial planners argue that the 4% rule can no longer be used and that the withdrawal percentage should be considerably lower.
With interest rates at 300-year lows and the 10-year US Treasury note hovering around 1.28% (as of July 2021) the traditional conservative fixed-income, bond-heavy retirement portfolio has been abandoned in favor of seeking extra yield and growth, often taking on additional risk in the overall portfolio in the form of dividend stocks and/or high-yield bonds.
In order to illustrate the potential negative impact of sequence of returns during the important first five years immediately following retirement, we have compared some hypothetical scenarios based on stock market history.
Assuming a retiree has $1,000,000 at the start of retirement and uses the traditional 4% withdrawal rate and a 2.1% annual increase for inflation, let’s compare how different market conditions and sequence of returns can affect the distribution phase of retirement.
Comparing Two Scenarios: It’s All About Timing
In both scenarios below, the retiree is 65 years old and retires with $1 million.
In both scenarios, the retiree withdraws 4% per year plus a 2.1% annual increase for inflation each year through age 86.
Scenario 2 shows the actual S&P average stock market returns from the years 2000 – 2021. Scenario 1 simply inverts and reverses those same returns, starting with the 2021 S&P average.
SCENARIO 1:
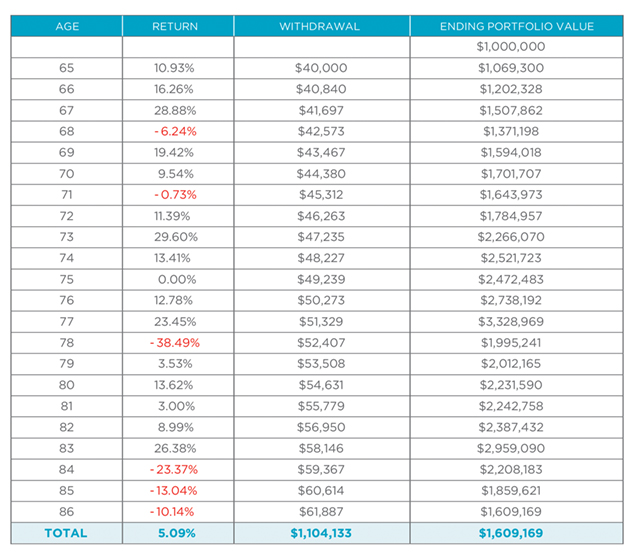
RESULT:
This hypothetical retiree was lucky—the portfolio was able to provide $1,104,133 in cumulative income withdrawals from age 65 through age 86 while still growing the account to $1,609,169 in value net of income.
Adding those two figures together, the total portfolio benefit to the client and heirs finished at $2,713,302.
SCENARIO 2:
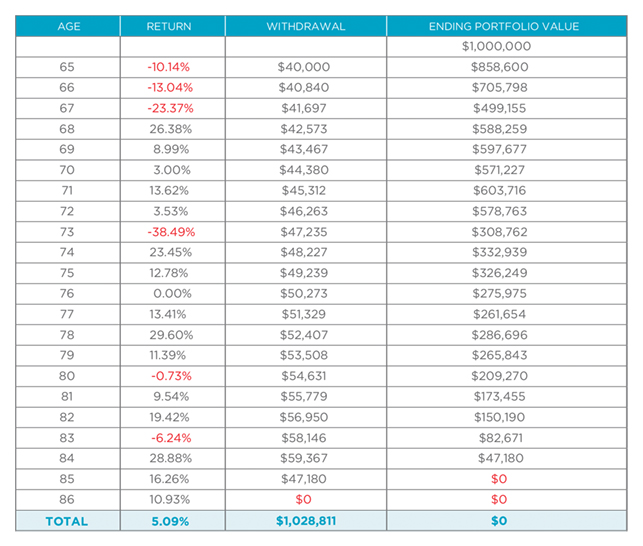
RESULT:
This hypothetical retiree was unlucky because market losses occurred early in the initial years of retirement. Even though the annualized returns were the same as Scenario 1, the timing of returns prevented this portfolio from being successful.
While the portfolio was able to provide $1,028,811 in cumulative income withdrawals, it was completely depleted in 20 years.
Fixed Indexed Annuities Address Three Retirement Risks—Including Sequence of Returns
An often-overlooked asset class for retirement is guaranteed income. A Fixed Indexed Annuity (FIA) with an optional Guaranteed Income Rider* provides guaranteed lifetime income that may help offset portfolio sequence of returns risk.
Guaranteed income lessens the reliance on the portfolio to generate income, helping mitigate the risk of negative timing of returns and providing security to cover income needs. In fact, the only asset class that can help mitigate three of the five risks in retirement—longevity, sequence of returns and income—is an annuity with guaranteed income.
Having guaranteed income gives the retiree the option to leave money in the portfolio during market downturns rather than being forced to take withdrawals for living expenses.
Scenario 2 Option: Adding an FIA
The hypothetical 65-year-old retiree with $1 million saved who experienced market downturns early in retirement could have avoided running out of money by using a guaranteed income fixed indexed annuity (FIA).
SCENARIO 2 WITH FIA:

RESULT:
If the retiree had allocated 20% of the portfolio into a fixed indexed annuity with guaranteed income, the FIA could generate $11,700 in guaranteed income annually and $245,700 in total as shown, assuming a 65-year-old male owns the FIA contract and income is deferred for one year.
In this scenario, the portfolio was able to provide $1,044,976 in cumulative income withdrawals while still maintaining a $160,346 portfolio balance.
NOTE: This result does not even include a potential increase in the fixed indexed annuity due to interest-crediting.
*FIA guaranteed amounts are guaranteed by an insurance carrier. These are hypothetical average numbers based off of A+ rated carriers. Optional enhancement riders may be added to the policy for an additional charge.
How Interest Rates Can Affect the Portfolio: A Look Back at Japan’s “Lost Decade”
According to Investopedia, Japan’s “Lost Decade” was a period that lasted from about 1991 to 2001 that saw a great slowdown in Japan’s previously bustling economy. The main causes of this economic slowdown were rising interest rates that set a liquidity trap at the same time that a credit crunch was unfolding.
In both of the illustrated scenarios below, the retiree is 65 years old and retires in 1990 with $1 million invested in the Nikkie 225 Index.
In both scenarios, the retiree withdraws 4% per year plus a 2.1% annual increase for inflation.
SCENARIO A, NIKKIE 225 INDEX:
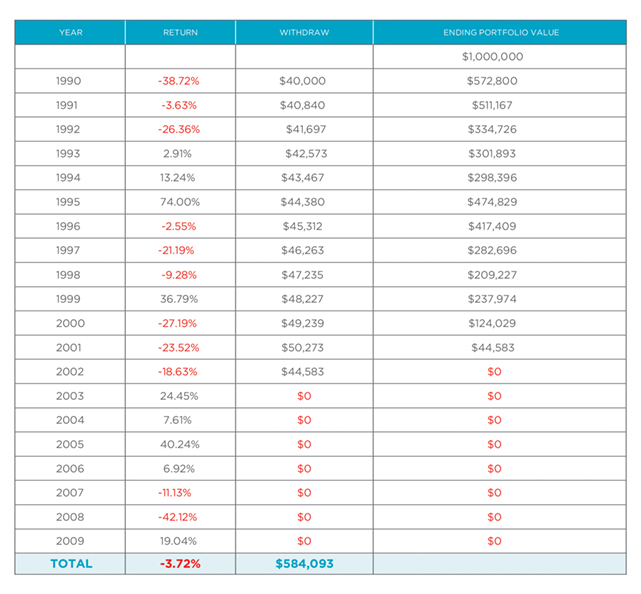
RESULT:
In Scenario A, the hypothetical retiree would have run out of money in 12 years, in 2002.
SCENARIO B, NIKKIE 225 INDEX WITH FIA:
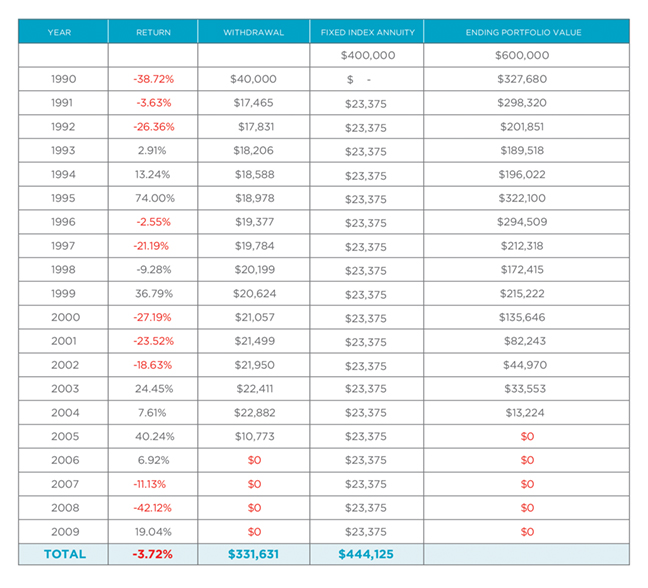
RESULT:
In Scenario B, even if the hypothetical retiree had allocated 40% to a guaranteed* FIA with an income rider, the portfolio would have been depleted by 2005.
But the client would still have received $23,375 yearly for the rest of their life.
*FIA guaranteed amounts are guaranteed by an insurance carrier. These are hypothetical average numbers based off of A+ rated carriers. Optional enhancement riders may be added to the policy for an additional charge.
Could History Repeat?
While history may not repeat, there is a saying that “it often rhymes.” While the United States may not experience a lost decade like Japan, it is something to consider and plan for. As the U.S. is potentially in the late innings of its current bull market run, it just makes sense to hedge against multiple retirement risks in the retirement portfolio.
Take a look at returns in the years leading up to Japan’s “Lost Decade” and returns in the United States since the financial crisis as of July 2021.
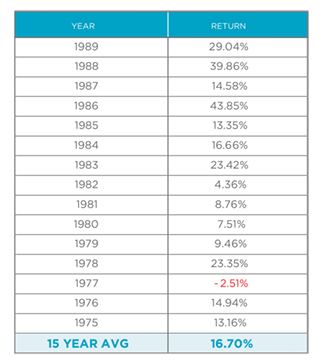
Japan’s Nikkie 225 returns for 15 years prior to the “Lost Decade”:
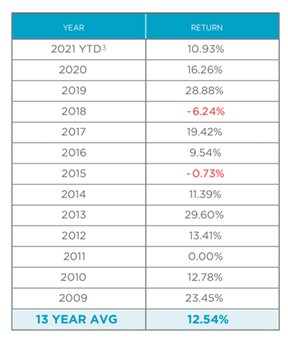
The US Current Bull Market (S&P 500) since the Financial Crisis:
If you have any questions, would like a second opinion, or would like to see how an FIA might fit inside your client’s portfolio, please call me at 800.440.1088. Or schedule an appointment with me here.
FOR FINANCIAL PROFESSIONAL USE ONLY
This material is not a recommendation to buy, sell, hold, or roll over any asset, adopt a financial strategy or use a particular account type. It does not take into account the specific investment objectives, tax and financial condition or particular needs of any specific person. You should work with your financial professional to discuss your specific situation. Guarantees are provided and backed by the financial strength of an insurance company. Optional enhancement riders may be added to the policy for an additional charge. Hypothetical average FIA numbers are based off of A+ rated carriers.

As a CERTIFIED FINANCIAL PLANNER™, former advisor and portfolio manager for one of the nation’s largest wirehouses, Andy understands what it is like to sit across from a client during good times, but more importantly, during bad times when markets are down.